My colleague Werner and I are holding a challenge this week to produce one visual work each day. I'm working around the theme of "Deconstructing Nature".
Day 1 — Day 2 — Day 3 — Day 4 — Day 5
For the last day I wanted to do something with human nature. And there is no better place on the internet to watch human nature decompose than 4chan (Warning: Not Safe For Work!). The website is a huge image board on a large number of topics ranging from Anime to Politics.
And then there's the "random" image board, also known as /b/, also known as the cesspool of the internet. I wanted to visualize the streams of data coming out of there, and with 4chan recently providing an API to their data, this might actually be feasible.
I use a veritable potpourri of Python libraries to bring everything together:
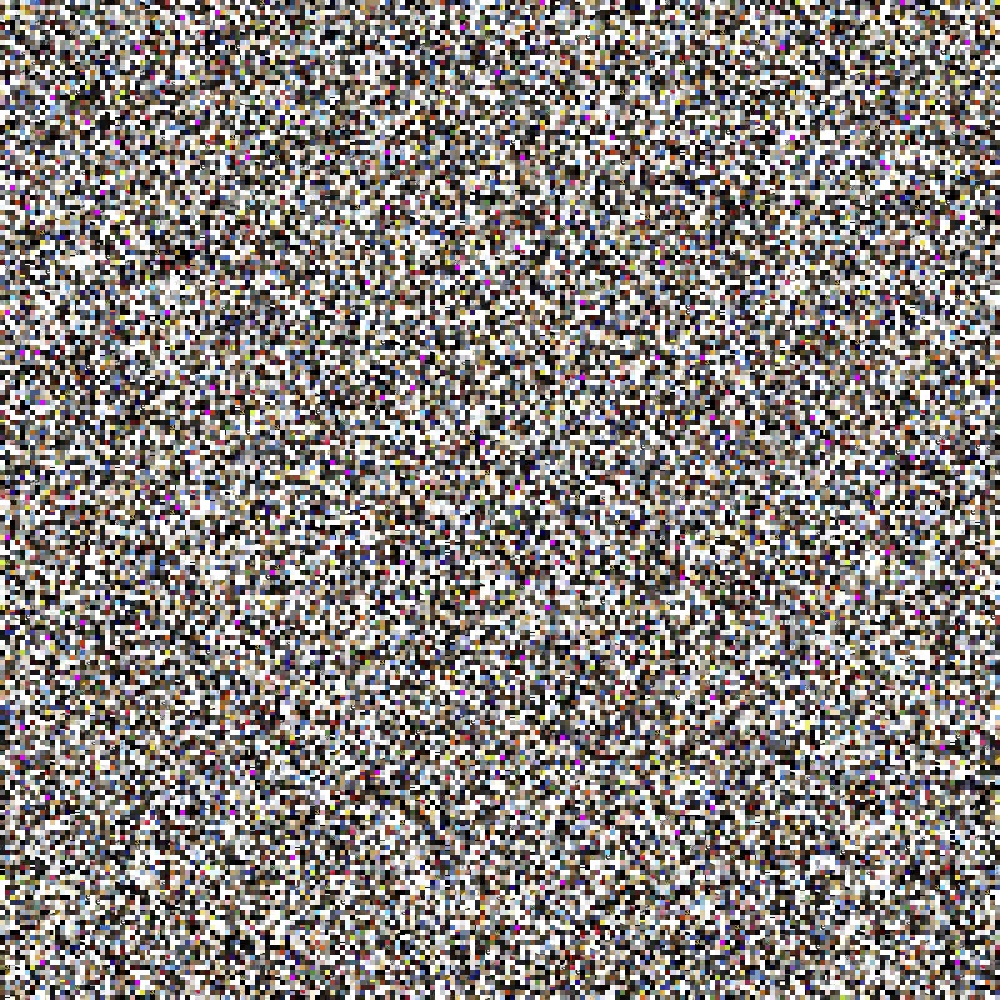
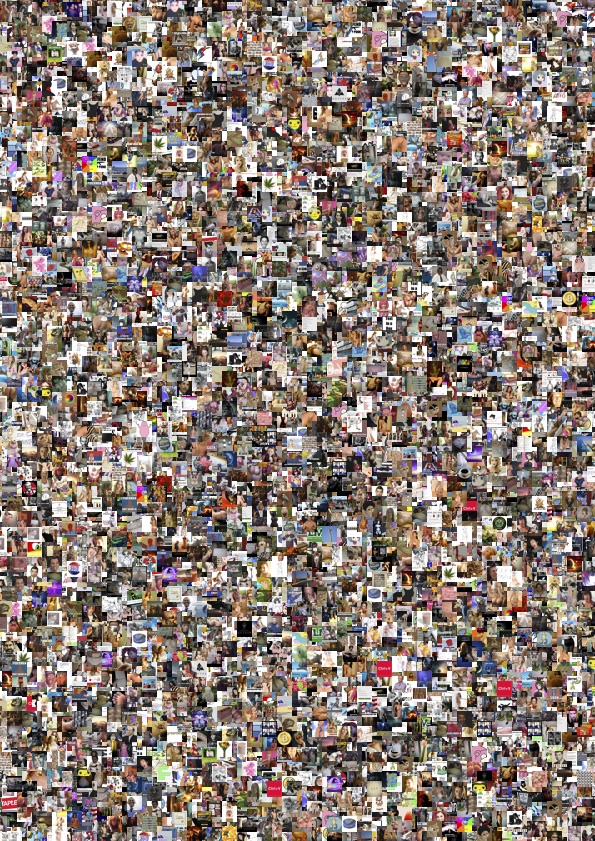
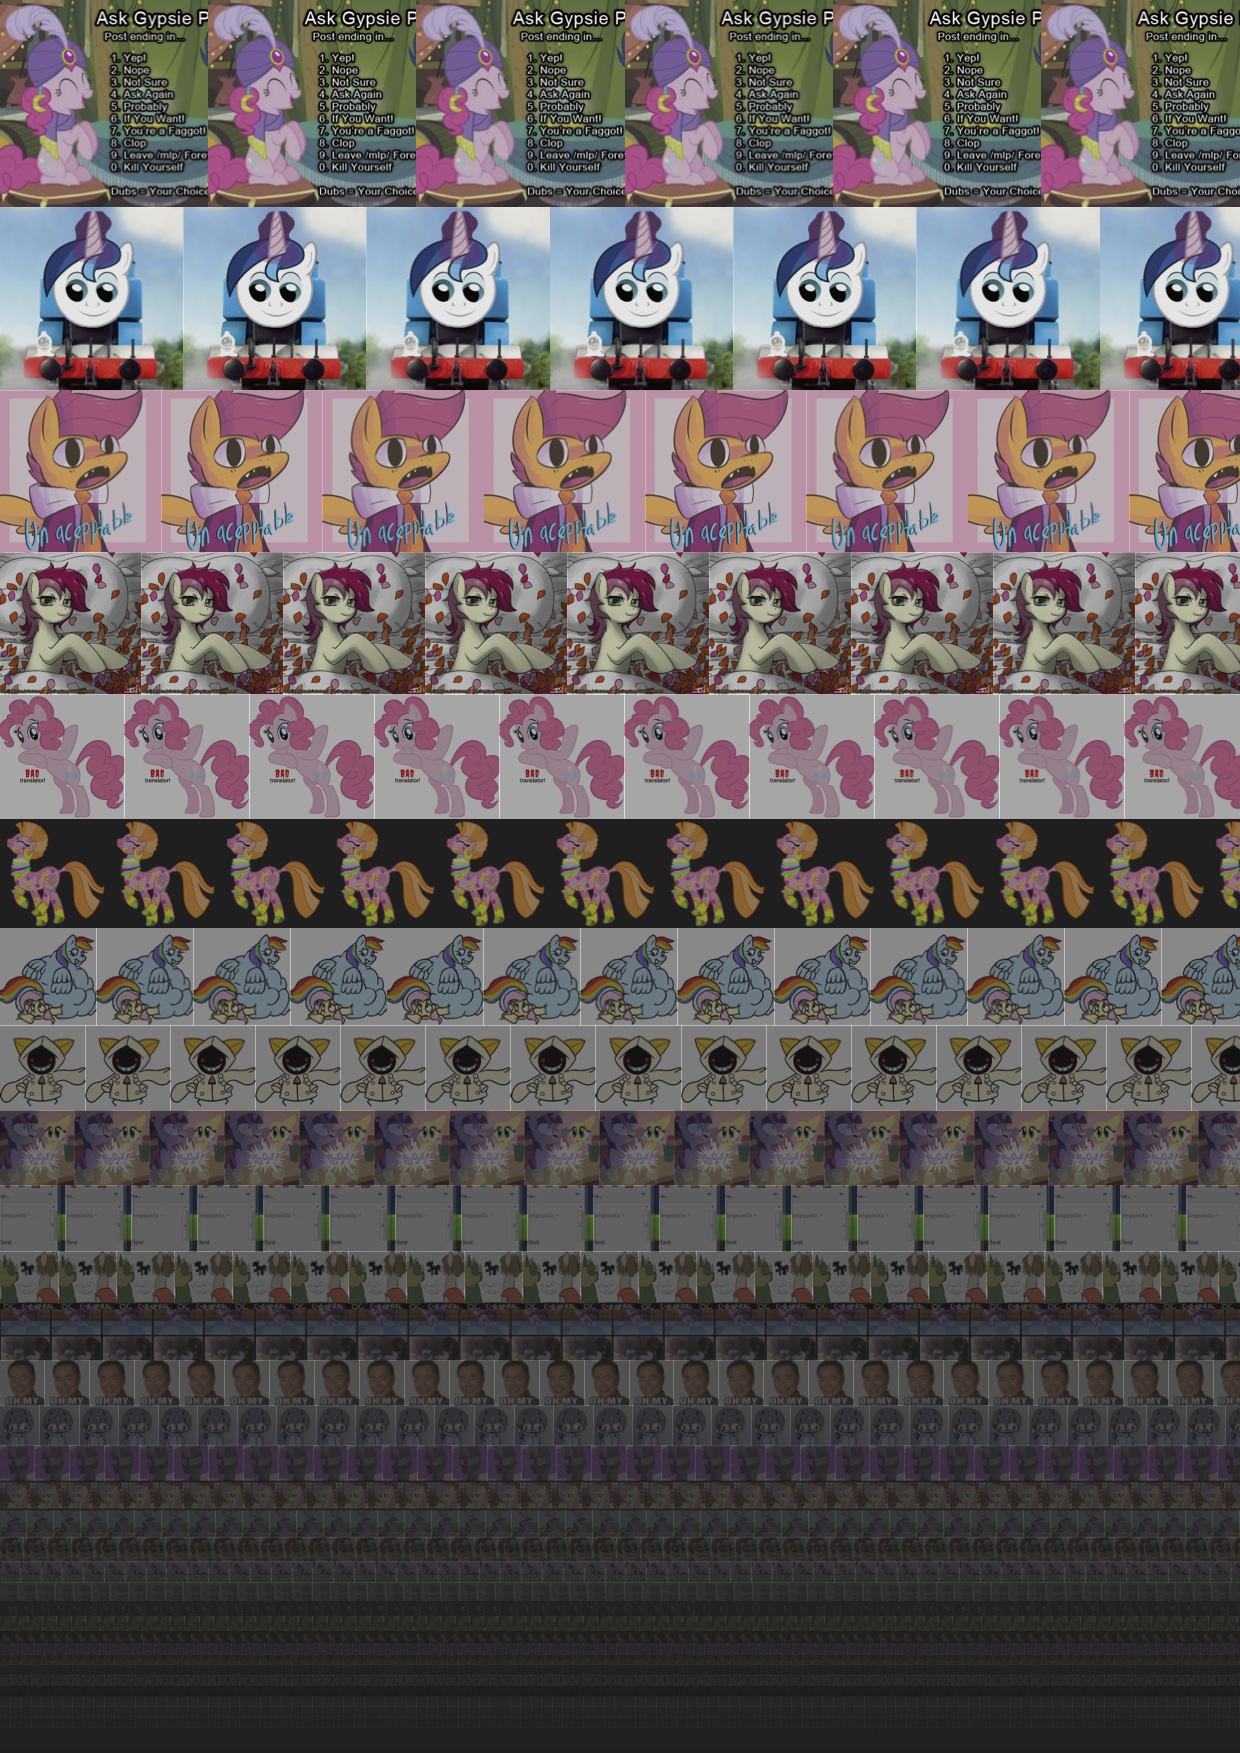
In the end, it was very hard to do something with images that are often gross, sometimes shocking and mostly bizarre. So I decided to abstract the representation:

Again, this is a visualization of the random image board. It would be interesting to see visualizations of the other thematic boars to see if they show different patterns.
Other sketches:


The source is available in the Deconstructing Nature GitHub repository.